Now that the Washington Metropolitan Area Transit Authority has released its new real-time train location data feed to the public, developers have jumped on the opportunity to explore new insights from the agency’s data.
At the latest Transportation Techies meetup, Metro Hack Night VI, programmers gathered in WMATA headquarters to share the projects they have developed since the new data API became available this summer, demoing new research questions, trip-planning apps, and personal curiosities.
Rail-time data
Not surprisingly, many passengers want to better understand how long it will take to reach their destinations. Reflecting this, many of the programmers developed projects to visualize train positions and the most efficient ways to navigate Metro.

Click for Sarah Klienman’s full Mapbox map.
Christopher Rung developed his Metro widget for MacOS that provides a quick-glance view of station arrivals. Sarah Kleinman created a Mapbox GL JS map to explore arrival times from a geographic perspective, and Ben Shepherd built DCTrainTracker.com to provide a streamlined visualization of train locations throughout the Metrorail system. Each tool would pair well with Joseph Haaga’s exploration of when it is faster to take an indirect route to work.
Haaga, like many commuters during the SafeTrack era, has found that he needs to be creative in how he uses Metro to get around. As a result, he has developed a program to calculate all of the possible train routes and their predicted times between origin and destination stations. In his example, there were seven alternative routes to his typical ride between U Street/Cardozo and Braddock Road stations, but with a Yellow Line train 25 minutes away, he found that it was still worthwhile to take a longer, less direct train combination. Though it is not a real-time map, the other presenters of the evening suggested it would be easy to combine with other tools.
A group of programmers, Sheila Haines, Catherine Janis, Aaron Margolis, and Paul Witt, developed a similar tool, employing machine learning to see if they can better predict trip lengths and delays. The project also reinforced existing ridership data conclusions, such as the fact that the Red Line is the most popular line, Wednesday is the most popular day for ridership, and Union Station is the most popular stop. More in-depth, the group was able to pick out the ripple effects of delayed trains farther back on their line: for every two minutes one train is delayed, it slows down the next by 40 seconds, and the effect generally clears out three or four trains later.
 Taking a slightly different approach from the rest, John Paz used Track Circuit Identifier data to build a track circuit diagram (right) and explore train connectivity as they navigate the rails. (CIDs are sensors placed along the tracks that monitor where a train is at any given moment.) Paz’s interconnecting map is especially interesting during SafeTrack surges or other incidents that require single tracking in areas, as it provides a new perspective on how WMATA might be moving trains around in unconventional ways. Also interesting: the Paz found CIDs for connector tracks among different lines that allow trains to switch to and from any line in the system.
Clock-watchers
Much of the conversation around Metro comes back to wait times, and that they tend to be long. Programmers have taken this open train and passenger data to dig into how long customers are waiting for their rides, and why.
But sometimes new data sources are necessary. Andrew Schmadel developed a data scraper to track Metro’s disruption reports and how the system’s performance is changing. Because these text-only reports do not exist as a data feed, Schmadel developed a script to pull them from WMATA’s website and organize them in a way that determines what is causing delays for the system, be it door problems or a deer getting stuck in a Red Line tunnel.
While Schmadel built out what is slowing down Metro, Keith Kelly’s “Metro Math” project dug into how long these issues make passengers wait. Using the real-time position feed, Kelly determined train headways and, in turn, the average amount of time passengers are likely to wait. Kelly broke these out by line, visualizing them to communicate the most and least reliable lines based on this metric.

Sam Winward’s graph of the types of it pays the most to wait for off-peak trips.
It also turns out that some passengers wait on purpose. Sam Winward delved interesting patterns in ridership decisions during peak and off-peak Metro hours. While it is reasonable to assume that some people will wait until off-peak hours to enter the Metro, Winward noticed that passengers in certain “sweet spots” of off-peak fare caps – based on how the length of their trip fit into WMATA’s fare calculations – were more likely to wait for the switch. They can save the most money compared to riders with different destinations, and have a strong enough incentive to enter Metro later in order to do so.
Behind the scenes
Two WMATA employees took the opportunity to share some of their internal data and tools that help the agency in its decision-making processes.
Sanghong Yoo demonstrated Metroview, one of WMATA’s internal, GIS-based tools that provides incredible amounts of information through a map view. On top of bus and train GPS locations, the tool can provide entry and exit data for every station, as well as figures for passenger destinations from each origin, such as the number of people who exit at Dupont Circle that entered at Union Station. Naturally, the data is much more granular than that made public, as the system can pull up “snapshots” of how many riders are in the system at any given moment.
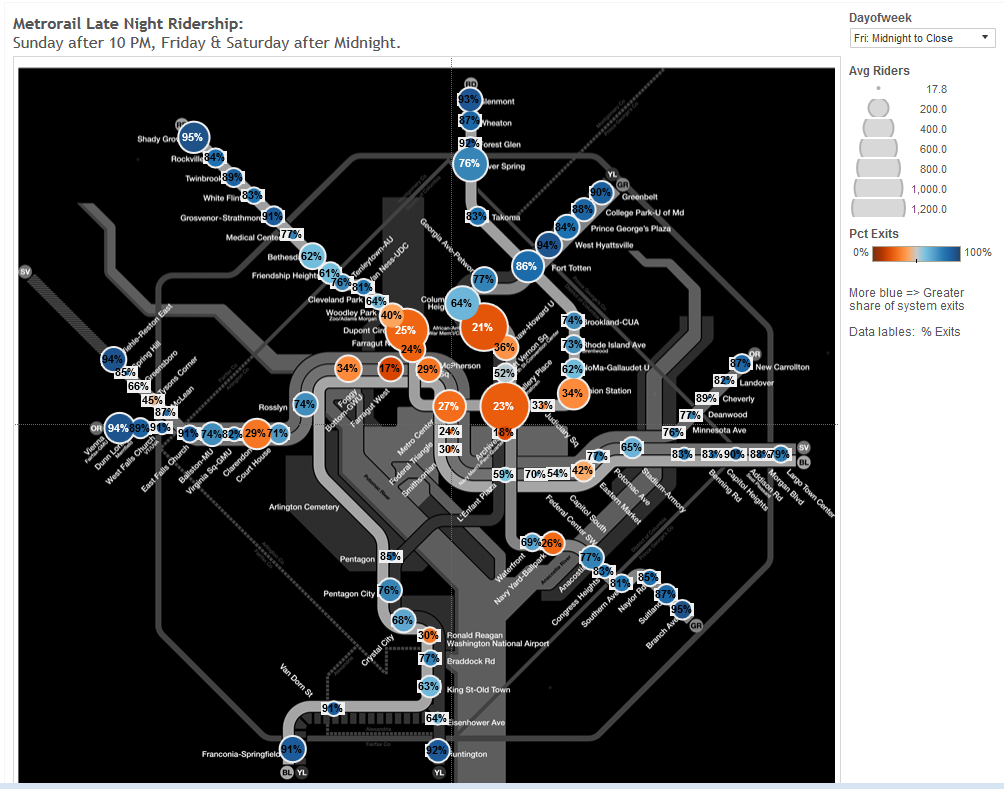
Michael Eichler, of WMATA’s Planning Department, closed out the night with a dive into Metro’s late-night ridership numbers, demonstrating what the agency has been researching to inform its proposals for late-night service cuts after SafeTrack ends in 2017. One example Eichler pointed out showed thaton Sunday nights, after 10 p.m., an average of 2,000 people per half hour typically use Metro. Eichler’s Tableau visualization offered a simplified way to estimate how many buses WMATA would need to cover that demand. Though published in September, the figures proved especially relevant to the meeting, as the morning after, Metro’s board of directors approved reduced late-night hours for the next two years.
With so much publicly available information, programmers are developing impressive insights into the Metrorail system, searching for ways to improve riders’ experiences as much as possible.
Photos: Top, Joseph Haaga presents his alternate route calculations (M.V. Jantzen, Flickr).
The post With real-time data now public, developers delving deeper into Metrorail insights appeared first on Mobility Lab.